

Is Home Service Demand Slowing in 2027? What the Data Says
November 15, 2026 · Joshua Filani
Home service demand is not falling off a cliff in 2027, but it is going flat. Harvard's Joint Center for Housing Studies projects homeowner improvement and repair spending of about $527 billion by the third quarter of 2027, only 1.5% above a year earlier, and that is before inflation. The work that is still growing is repair and replacement, sold one urgent job at a time to homeowners who get more quotes than they used to.
The October 2026 Leading Indicator of Remodeling Activity puts 2027 spending growth at 1.5% in nominal dollars, which is roughly flat or slightly negative once you account for inflation. Fewer homeowners are starting projects (40% in Q1 2026, down from 44% a year earlier, per HIRI), but the ones who do are spending more per project. Plan 2027 marketing around repair and replacement calls, fast response, and estimate follow-up, not around a demand wave that the data does not show.
We read the forecasts and surveys published between May and November 2026. Here is where they agree, where they do not, and what we would do about it.
Want a free audit of your own site?
Send us your website and we will review your Google, website and lead tracking, then email you what to fix first. No pitch.
Free. Read-only. We change nothing on your site.What do the 2027 forecasts actually say?
The best single forecast here is Harvard's quarterly Leading Indicator of Remodeling Activity, or LIRA. It covers improvement and repair spending on owner-occupied homes, so the water heater swap counts, not just kitchen remodels.
The October 22, 2026 release says annual spending is "expected to remain relatively flat through late 2027," with year-over-year growth reaching 1.5% by the third quarter and annual spending moving from $524 billion in 2026-Q4 to $527 billion in 2027-Q3 (Harvard JCHS, 2026). Program director Rachel Bogardus Drew put it plainly: "We expect annual spending to hover around $525 billion through the third quarter of next year."
What is useful is watching how the forecast moved across three releases this year:
| LIRA release | Forecast reaches | Projected annual spending | Year-over-year growth at that point |
|---|---|---|---|
| May 5, 2026 | 2027-Q1 | $523 billion | 0.5% |
| July 23, 2026 | 2027-Q2 | $519 billion | 0.5% |
| October 22, 2026 | 2027-Q3 | $527 billion | 1.5% |
Sources: JCHS May 2026, JCHS July 2026, JCHS October 2026.
The October number looks better than the summer ones, but part of that is bookkeeping. JCHS notes that the Census Bureau re-benchmarked its retail sales estimates in September 2026, which shifted some LIRA spending estimates back to 2018 by less than 1%. So do not read the jump from $519 billion to $527 billion as a recovery. Read all three together: somewhere between half a percent and one and a half percent of nominal growth, for a full year. That is a flat market.
Chris Herbert, the Center's managing director, added a warning in October that housing starts keep declining and "these ongoing headwinds could slow growth in remodeling spending even further in the quarters ahead."
Is 1.5% growth actually growth?
Not really. LIRA figures are nominal dollars. Prices for parts, equipment and labor go up every year, so a 1.5% increase in dollars spent can mean fewer actual jobs.
Here is the rough math. Jobber's Q2 2026 Home Service Economic Report cites Bureau of Labor Statistics inflation of 4.2% in May 2026 and 3.5% in June 2026 (Jobber, 2026). If general inflation ran anywhere near 3.5% through 2027, a 1.5% nominal gain works out to about 1.5 minus 3.5, or roughly negative 2% in real terms. That is a back-of-envelope estimate, not a forecast, and inflation could cool. But even at 2% inflation you would be at about negative half a percent.
The National Association of Home Builders reads things a little more warmly. Its chief economist, Robert Dietz, said the third-quarter Remodeling Market Index reading of 62 is "consistent with NAHB's projection for remodeling activity to remain stable in 2026 and grow slightly in 2027" (NAHB, 2026). So the two main sources disagree on tone: Harvard calls it stagnation, NAHB calls it stability with a little growth. They agree on the important part. Nobody is forecasting a boom.
The pie is not getting bigger. Revenue growth in 2027 will mostly come from taking share or charging more per job.
Where is the money going: repairs or remodels?
Repairs, by a wide margin. This is the most consistent finding across every source we read.
The Home Improvement Research Institute's Q1 2026 tracker found that among homeowners, 74% of completed projects involved maintenance and 68% involved repair, compared with 36% for renovation. The pullback in activity, HIRI says, "is mostly concentrated in discretionary renovation, while maintenance and repair have held firm." It also found that 62% of homeowners chose to repair something instead of replacing it in Q1 2026, up from 51% in Q4 2025 (HIRI, 2026).
Housecall Pro's survey of more than 1,100 U.S. homeowners, released in May 2026, lines up with that. It found 79% expect to repair or replace at least one home system in 2026, 69% live in homes more than 20 years old, and 72% plan to stay in their current home for the foreseeable future. The top reason homeowners contact a pro is a sudden problem that needs immediate attention (58%), followed by a smaller issue that got worse (51%) (Housecall Pro, 2026).
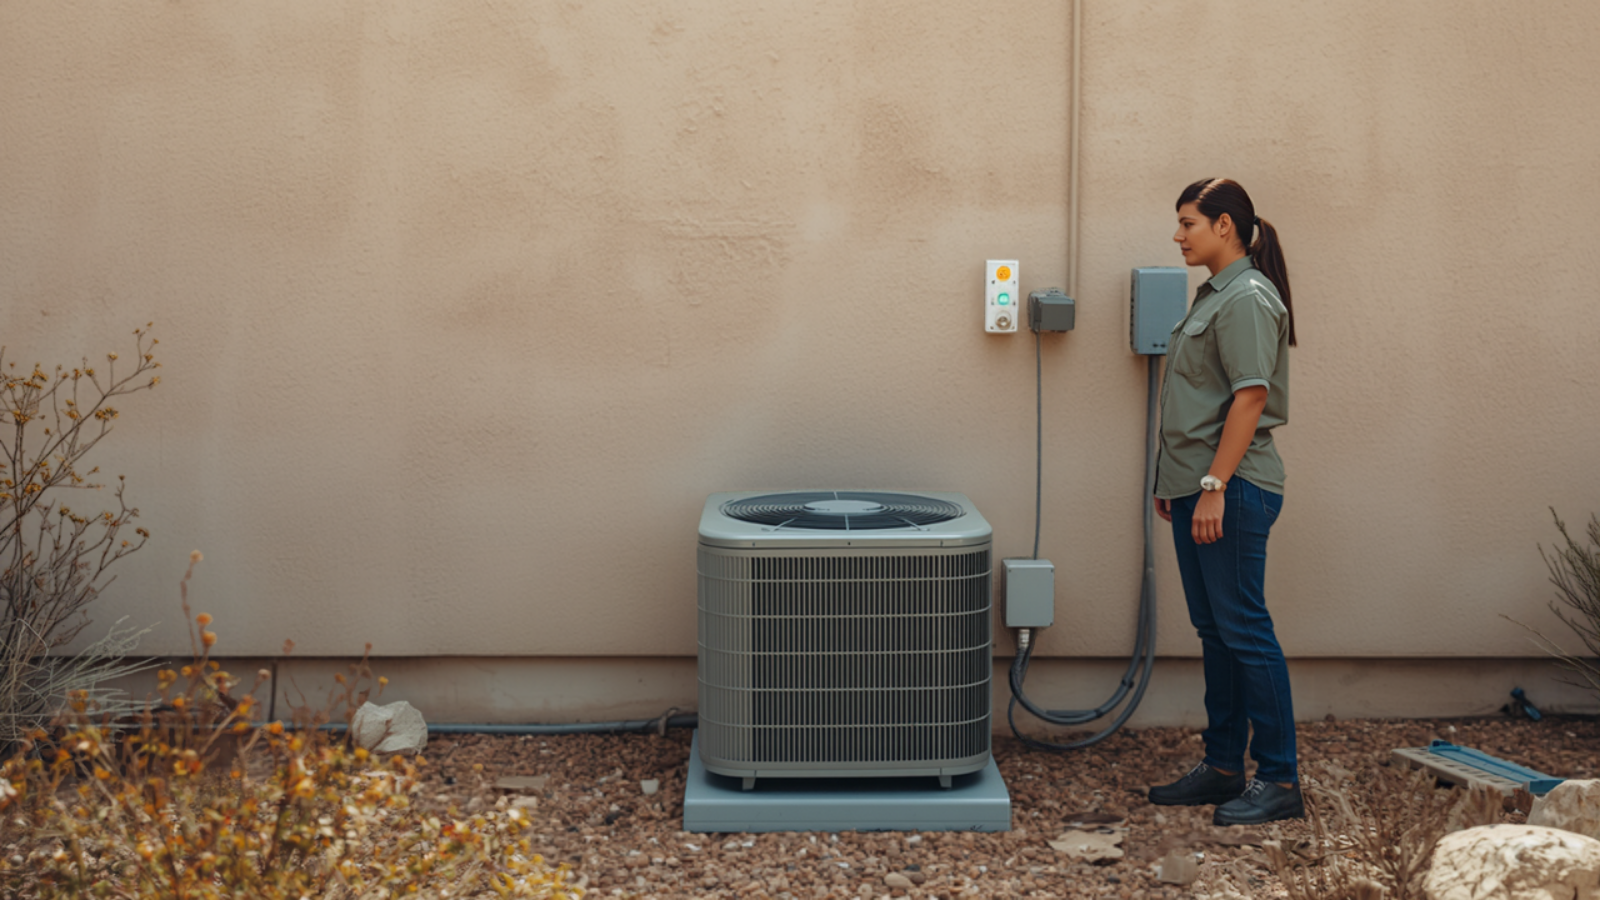
People are not moving, their houses are aging, and they fix what breaks. That favors failure-driven trades like plumbing, HVAC, electrical and roofing repair over work that depends on someone wanting a new kitchen.
Fewer homeowners, bigger tickets
The participation numbers are the part that should change how you think about lead volume. HIRI found only 40% of homeowners completed a home improvement project in Q1 2026, down from 44% in Q1 2025, the lowest in five quarters. But among those who did a project, average spending rose to $5,368 from $3,957 (HIRI, 2026).
That is a 36% jump in spending per project ($5,368 divided by $3,957 is 1.357). Multiply participation by average spend and you get a rough per-homeowner figure: 0.44 times $3,957 is about $1,741 in Q1 2025, and 0.40 times $5,368 is about $2,147 in Q1 2026. Treat that as directional. It is survey data, it mixes inflation into the dollar figures, and one quarter is a small window. But the direction matches what software companies see in their own transaction data.
Jobber, which pulls data from more than 100,000 service businesses, described Q2 2026 this way: "Fewer new jobs booked, made up for by charging more per job, was the major headline of the quarter." Its Green segment (lawn and landscaping) saw bookings slide 3.7% in April and May while median revenue rose 13.8% in April. Cleaning bookings fell every month of the quarter, bottoming at a 5.2% drop in May, while revenue still grew (Jobber, 2026).
If you judge your ads purely by lead count, 2027 will look worse than it is. Fewer calls at a higher ticket can still be a good month. Track revenue per lead.
Are homeowners still hiring pros, or doing it themselves?
More of them are hiring help, just not for the whole job. HIRI's completion-method numbers moved sharply between Q1 2025 and Q1 2026:
| How the project was done | Q1 2025 | Q1 2026 | Change |
|---|---|---|---|
| DIY (including unpaid help) | 48% | 39% | -9 points |
| DIY plus a contractor | 26% | 46% | +20 points |
| Hired contractor only | 26% | 15% | -11 points |
| Any contractor involvement (our sum) | 52% | 61% | +9 points |
Source: HIRI quarterly trackers, June 2026. The last row is our addition of the two contractor rows.
So a contractor touched 61% of projects in Q1 2026, up from 52%. But the share where the homeowner handed over the whole job fell from 26% to 15%. People are splitting the work: they demo the old vanity themselves and pay a plumber to set the new one. HIRI says the top reasons they hire a pro are technical expertise (61%) and work quality (54%).
Housecall Pro found a similar line in the sand: 57% of homeowners say they would hire a pro instead of trying a repair themselves once the job costs $500 or more (Housecall Pro, 2026).
Our read: offering smaller, clearly priced scopes ("we install, you supply," "diagnostic visit only," "rough-in only") is a reasonable way to catch the hybrid crowd instead of losing them to a full DIY attempt.
What contractors are seeing in their own books
Surveys of homeowners tell you intent. Contractor data tells you what actually got booked, and it is steadier than the homeowner surveys suggest.
NAHB's Remodeling Market Index came in at 62 for Q3 2026, up one point. Anything over 50 means more remodelers see conditions as good than poor. The leads-and-inquiries component rose two points to 53, and the backlog component rose two points to 56 (NAHB, 2026). Note that 53 on leads is the weakest part of the index. It is positive, barely.
NAHB's state-level estimates for Q2 2026 were even flatter: spending fell in 26 states and rose in 24, with an average growth rate of 0.0% (NAHB, 2026).
Jobber's Contracting segment (electricians, HVAC, plumbers and other trades) shows the month-to-month swings that flat annual numbers hide. In Q1 2026, revenue was down 3% and new work down 4% year over year in January, then revenue grew 10% and new work 8% in March (Jobber, 2026). In Q2, bookings dipped in April and May before revenue jumped 6.4% in June "as urgent repair jobs picked back up" (Jobber, 2026).
Our read: homeowners hesitate, then the problem gets bad enough and they call. Demand arrives late and in bursts, and the business that answers during the burst gets the job.
Want a free audit of your own site?
Send us your website and we will review your Google, website and lead tracking, then email you what to fix first. No pitch.
Free. Read-only. We change nothing on your site.Why homeowners are getting more quotes
A flat market with rising prices produces a pickier customer. The Housecall Pro survey numbers on this are worth reading slowly (Housecall Pro, 2026):
- 77% say they are delaying or reducing the scope of home projects.
- 68% seek additional quotes when a price comes in higher than expected.
- 62% are more likely to move forward when financing is offered.
- 72% would pay more to get an emergency issue fixed within 24 hours.
- 41% say they postponed a repair that later became more expensive.
One caution: Housecall Pro sells contractor software, so weigh its survey accordingly. HIRI's separate tracker found the same shift toward repairs and a rise in card payments (30% of activity in Q1 2026, up from 25%), which makes us more comfortable with it.
The practical consequence is that your estimate is now one of two or three on the kitchen table. The contractor who answers first, explains the price clearly, offers a payment option and follows up is going to win more of those comparisons. We wrote about the follow-up side of this in how contractors can follow up on unsold estimates, and it matters more in a market like this one.
What this means for each trade
Housecall Pro asked homeowners which projects they plan in 2026. Plumbing led, which fits a repair-driven market. Here is that list with our read on what it means for 2027 marketing. The percentages are sourced; the right-hand column is our opinion.
| Project category | Homeowners planning it in 2026 | Our read for 2027 marketing |
|---|---|---|
| Plumbing | 28% | Steady, failure-driven demand. Be reachable around the clock; emergency calls carry the margin. |
| Appliances | 25% | Repair-versus-replace decisions favor repair techs who quote fast. |
| Exterior work | 23% | More discretionary. Expect longer decision cycles and more quote shopping. |
| HVAC | 20% | Replacement jobs are big tickets; financing and follow-up decide who wins them. |
| Electrical | 18% | Mix of repair and upgrade; smaller scoped offers catch hybrid DIY homeowners. |
| Roofing | 14% | Repair calls hold up; full replacements stretch out. Track revenue per lead, not lead count. |
Source for percentages: Housecall Pro State of Home Service Spending (2026).
Remodelers and kitchen and bath contractors face the toughest year. HIRI found renovation is where the pullback is concentrated, and Herbert at JCHS tied a rebound to home sales: "Until home sales rebound from current low levels, remodeling expenditures are likely to stay at this pace" (Harvard JCHS, 2026).
What about Arizona specifically?
We found no reliable public 2027 forecast for Arizona home service spending. NAHB's Q2 2026 state release did not name Arizona among its top five markets or top five gainers, and we will not guess a number it does not give.
Here, a dead AC compressor in July is a same-day call, not a deferred project. That puts HVAC, plumbing and pool equipment repair in the most protected part of the market. The 72% of homeowners who would pay more for a 24-hour fix are the customers a Valley HVAC shop sees every summer.
The flip side is the shoulder season, when discretionary jobs are the ones homeowners postpone. If you run a business in Phoenix, expect the gap between July and November to look wider in 2027.

What we would do with a 2027 marketing budget
Here is our recommendation, and it is a little opinionated.
Do not cut ad spend because of a headline about slowing remodeling. The slowdown is in discretionary renovation. Repair demand is holding, and when the market flattens, the businesses that keep showing up in search pick up share from the ones that go quiet. If you sell repair and replacement, hold your budget steady and spend it more carefully.
Do cut wasted spend. In a flat market every unanswered call costs more because there are fewer of them. Before adding budget, look at how many calls go to voicemail and how long web leads wait. If you are missing calls after hours, a voice receptionist or a text-back setup is cheaper than buying more clicks. We would fix that first.
Follow up on every estimate. With 68% of homeowners getting another quote when the price surprises them, the second and third touch is where jobs are won. A simple follow-up sequence that texts at day two and day seven, offers financing and answers questions will close jobs you are currently losing in silence.
Put financing in your ads and on your site. 62% of homeowners say financing makes them more likely to go ahead. If you offer it and it is buried on page four, move it up.
Budget by revenue per lead. Our guide to setting a service business marketing budget walks through the method. In 2027, check average ticket alongside cost per lead every month.
When we would tell you not to spend more with us: if you are a remodeler whose pipeline is already full into spring, or a one-truck operator who cannot take more calls, more advertising is the wrong move. Fix scheduling and capacity first. If you are not sure which camp you are in, start with a free audit and we will tell you honestly.
If you want the longer view behind these forecasts, the Harvard Joint Center's own video presenting its Improving America's Housing 2025 report is the source material the quarterly LIRA builds on. Watch for what it says about aging homes and who is doing the spending, since that is the engine behind the repair demand described above. Credit: Harvard Joint Center for Housing Studies on YouTube.
Questions owners ask
Is home service demand going down in 2027?
Not in dollar terms, but it is close to flat. Harvard's LIRA projects 1.5% nominal growth in homeowner improvement and repair spending by 2027-Q3, to about $527 billion, which is roughly flat or slightly negative after inflation. Repair and maintenance work is holding up better than remodeling.
Which trades are safest in a flat market?
Trades with failure-driven calls: plumbing, HVAC, electrical, appliance repair and roofing repair. HIRI found maintenance and repair held firm in Q1 2026 while discretionary renovation pulled back, and plumbing topped Housecall Pro's list of planned 2026 projects at 28%.
Should I cut my marketing budget for 2027?
We would not cut it just because of a slowdown headline, especially if you sell repair and replacement. We would cut waste first, such as missed calls and leads that never get a follow-up, and judge spend by revenue per lead instead of lead count.
Why am I getting fewer leads but bigger jobs?
That matches the data. HIRI found fewer homeowners did projects in Q1 2026 (40% versus 44%) but average spending per project rose to $5,368 from $3,957, and Jobber reported fewer new jobs booked offset by higher charges per job in Q2 2026.
Do homeowners still hire contractors or are they doing it themselves?
More projects involve a contractor, but fewer are fully handed off. HIRI's numbers show contractor involvement rose from 52% to 61% of projects between Q1 2025 and Q1 2026, while contractor-only jobs fell from 26% to 15%. Smaller, clearly scoped offers can catch those hybrid customers.
Is there a 2027 forecast for Arizona home services?
We could not find a reliable public one. NAHB publishes state remodeling estimates, but its Q2 2026 release did not name Arizona among the top markets or biggest gainers, and we will not guess a figure. Locally, heat-driven HVAC and plumbing repairs are the most protected part of demand.
Want to know if your marketing is ready for a flat 2027?
We will look at your calls, ads and follow-up and show you where jobs are slipping away before you spend another dollar on leads. Start with your free audit, compare our pricing, or call us at (623) 343-3141.
Sources
- Harvard Joint Center for Housing Studies: Remodeling Spending Continues to Stagnate (2026)
- Harvard Joint Center for Housing Studies: Remodeling Spending Poised for Further Slowdown (2026)
- Harvard Joint Center for Housing Studies: Remodeling Growth to Slow Sharply in Early 2027 (2026)
- Home Improvement Research Institute: Quarterly Trackers, Q1 2026 Homeowner and Contractor Trends (2026)
- Housecall Pro: The State of Home Service Spending report release (2026)
- Jobber: Home Service Economic Report, Q2 2026 (2026)
- Jobber: Home Service Economic Report, Q1 2026 (2026)
- NAHB: Remodeling Market Sentiment Remains Stable in Third Quarter Despite Headwinds (2026)
- NAHB: Remodeling Activity Holds Flat in Second Quarter Amid Housing Slowdown (2026)
- Harvard Joint Center for Housing Studies: Improving America's Housing 2025 (video)
Everything Valley Does
AI marketing agents and full website builds — all under one roof.
Serving service businesses across the Phoenix Valley
Free tools
How Valley Can Help
We Help Businesses Like Yours Get More Leads — and Close More of Them
The Valley Marketing Group is a Phoenix-based marketing agency specializing in AI-powered lead generation, paid advertising, and web development for local service businesses.
- Google Ads & paid search — campaigns built to generate qualified leads, not just clicks
- AI phone receptionist — never miss a call or lead while you're on the job
- Website design & development — WordPress, Webflow, Shopify, WooCommerce
- SEO content & local search — rank for the searches your customers are already making
Not Sure Where to Start?
We'll look at your website, ads, and Google Business Profile for free and show you the highest-impact fixes for your business.
No generic report. No obligation.
Get My Free Audit